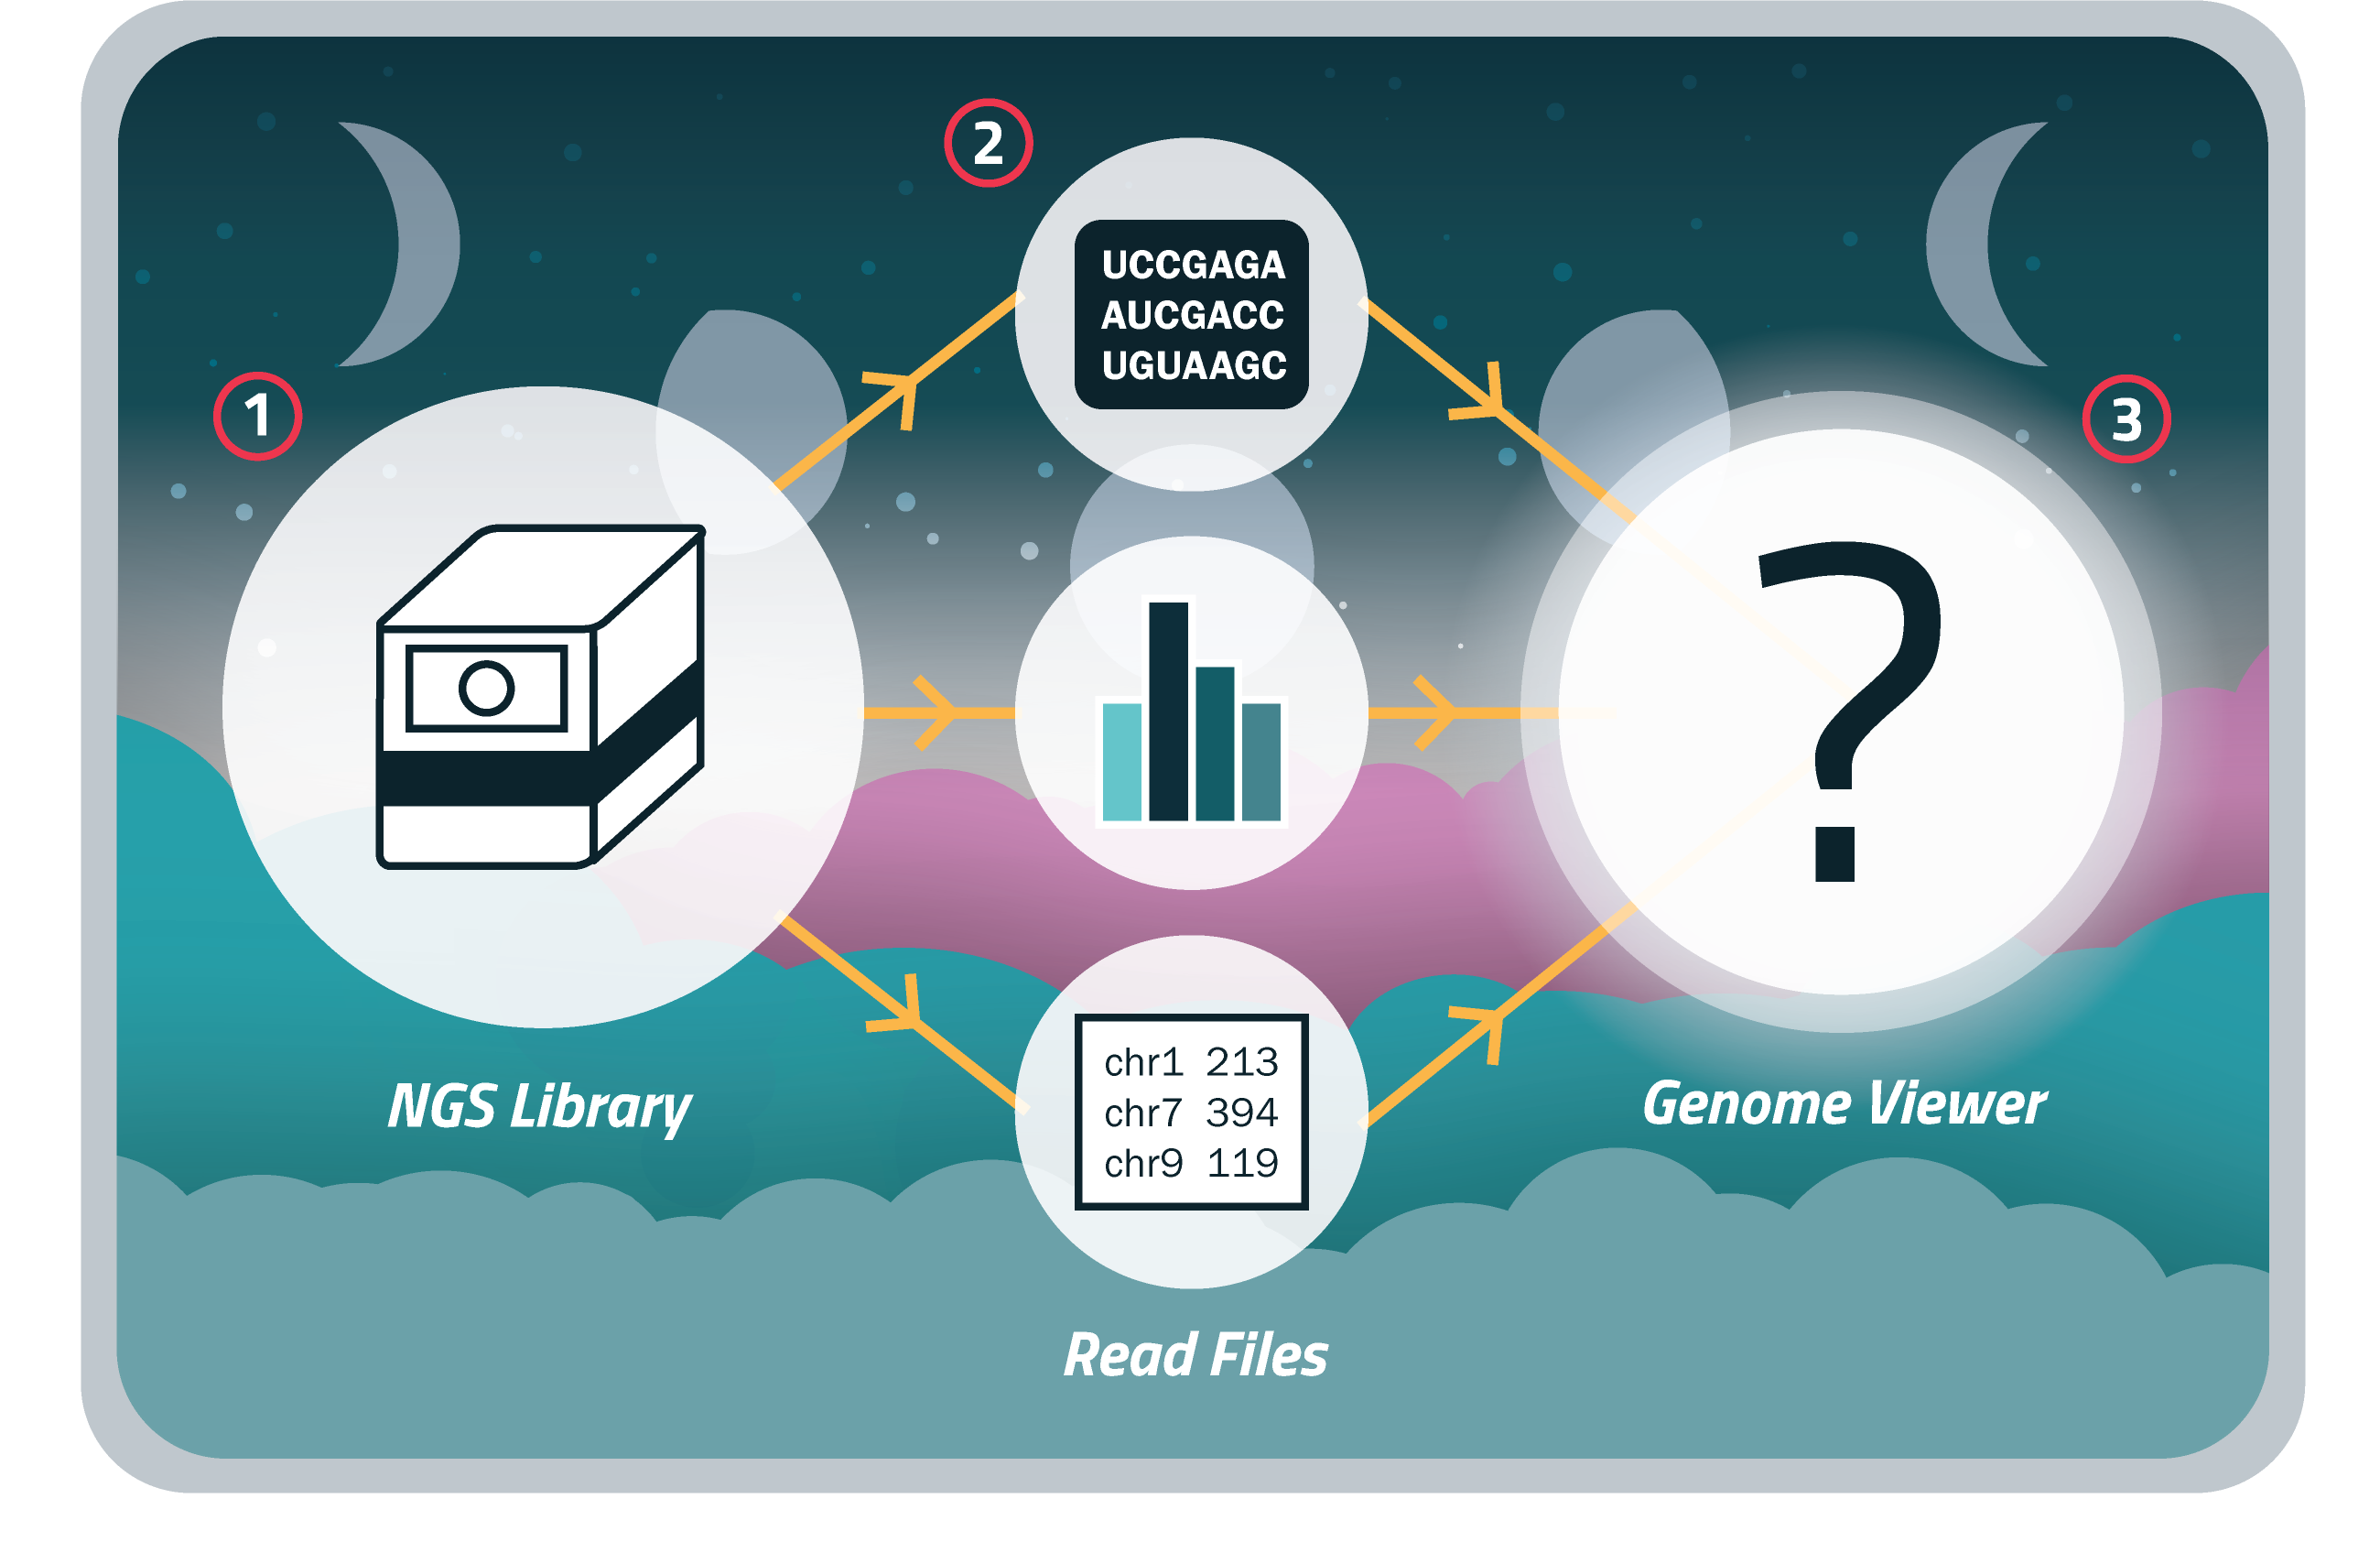
Next-generation sequencing (NGS) libraries produced by Eclipsebio’s assays typically consist of reads derived from targeted RNA regions. A visualization tool allows you to see which genes are present in your samples of interest and, depending on the assay, which specific transcript regions are enriched. To help with visualization, Eclipsebio’s service deliverables include BAM, bigWig, and BED files. Interpretation and visualization of these NGS files can be challenging, but with genomics viewers such as the Integrative Genomics Viewer (IGV), you can easily explore your data.
We covered the basics of IGV in the original “How to Use IGV” Bioinformatics eBlog including genome selection, uploading files, navigating to regions of interest, styling tracks, and exporting images. If you have mastered the basics and are looking to learn more about using IGV, in this blog we will go over several more advanced topics.
1) Custom genomes
Although IGV hosts many different genomes, you may be working with a genome that is not currently supported. If you are using a custom genome, click on the “Genomes” dropdown menu and choose “Load Genome from File” to load your genome from a FASTA file. You will likely need an associated index (fasta.fai) file in the same location as your FASTA file as well. Note that custom genomes will not include a preloaded transcriptome annotation like hosted genomes do.
2) Sorting and indexing files
Many files require an associated index before being loaded into IGV, and typically these files must be sorted before the index file can be produced. If you do not have the software tools required to sort and index files on the command line, you can run these steps in IGV. Select “Tools” followed by “Run igvtools”. In the “Commands” dropdown menu, you will find the “Sort” and “Index” tools which you can run to prepare files for upload into IGV.
3) Finding motifs
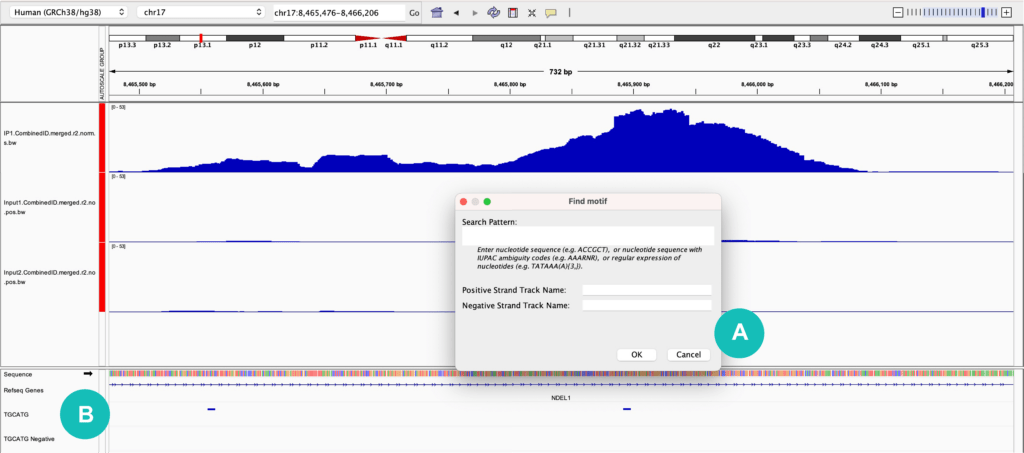
One useful feature in IGV is the ability to search for and annotate a sequence of interest with the “Find Motif” feature. This is found under the “Tools” dropdown menu and allows you to input a motif of interest using IUPAC nucleotide codes or standard A, C, G, and T nucleotides (for RNA motifs you will need to use T in place of U). Once a sequence is input, a track will be created for both the positive and negative strands, indicating where that motif is found in the genome (Figure 1). When viewing RBP-eCLIP data for example, it is helpful to look for the binding motif of the protein of interest and confirm that it overlaps with identified binding sites.
4) Copying sequences of interest
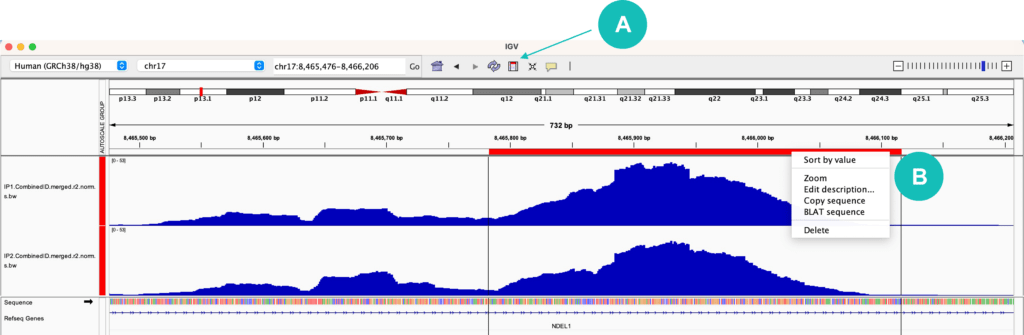
When browsing different regions or genes in IGV, you may find that it is helpful to copy a sequence of interest. At the top of the IGV window, there is a rectangular icon that allows you to “Define a region of interest”. Once this button is selected, choose a start position and stop position within your tracks to highlight your region of interest. A red bar should appear within your selection. Clicking on this red bar allows you to zoom into the selected region, copy the sequence of the region, or BLAT the sequence to identify similar sequences across the entire genome (Figure 2). If you want to copy the reverse complement sequence (the opposite genomic strand), click on the black arrow icon next to the “Sequence” track.
5) Working with sessions
If you would like to fully reset your current session, select the “File” dropdown menu and choose “New Session”. This will remove all tracks and reset the window to the completely zoomed out view of your selected genome. You can also save your current session by selecting the “File” dropdown menu and choosing “Save Session”. This will create a .xml file that saves your current tracks and customizations, so that you can revisit it later.
Aside from what we have detailed above and in our previous eBlog, IGV has many other capabilities for interacting with and visualizing NGS data. You can visit the IGV website to download the IGV application and to view more complete documentation.
References:
igv.org | IGV: Integrative Genomics Viewer